Creates a dot plot. For data in groups, the dot plot can be displayed stacked or in separate regions.
Usage
dotPlot(
  x,
  group,
  xlim,
  ylim,
  col,
  xlab,
  ylab,
  pch,
  cex,
  breaks,
  stacked = TRUE,
  main,
  showPlot = TRUE
)
Arguments
- x
A numeric vector containing the values to be plotted.
- group
(Optional) A vector for grouping the values. This determines the grouping of the data points in the dot plot.
- xlim
A numeric vector of length 2 specifying the limits of the x-axis (lower and upper limits).
- ylim
A numeric vector of length 2 specifying the limits of the y-axis (lower and upper limits).
- col
A vector containing numeric values or strings specifying the colors for the different groups in the dot plot.
- xlab
A title for the x-axis.
- ylab
A title for the y-axis.
- pch
A vector of integers specifying the symbols or a single character to be used for plotting points for the different groups in the dot plot.
- cex
The amount by which points and symbols should be magnified relative to the default.
- breaks
A numeric vector specifying the breakpoints for binning the values in
x.- stacked
A logical value indicating whether the groups should be plotted in a stacked dot plot (default is
TRUE).- main
A title for the plot.
- showPlot
A logical value indicating whether to display the plot. Default is
TRUE.
Value
A list cointaining:
An invisible matrix containing
NAs and numeric values representing values in a bin. The number of bins is given by the number of columns of the matrix.The graphic.
Details
Values in x are assigned to the bins defined by breaks. The binning is performed using hist.
Examples
# Create some data and grouping
set.seed(1)
x <- rnorm(28)
g <- rep(1:2, 14)
# Dot plot with groups and no stacking
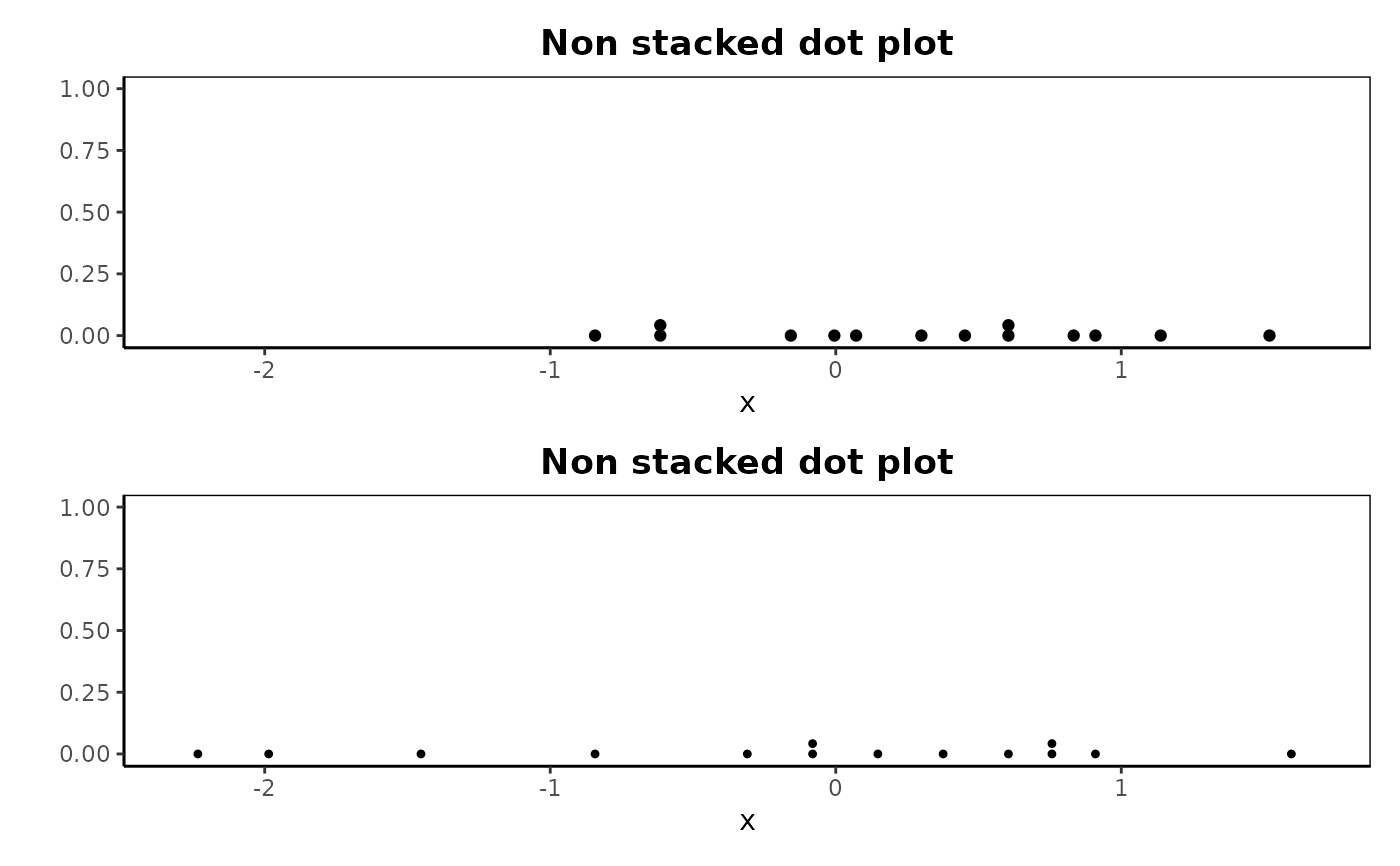
dotPlot(x, group = g, stacked = FALSE, pch = c(19, 20), main = "Non stacked dot plot")
#> Warning: calling par(new=TRUE) with no plot
 # Dot plot with groups and stacking
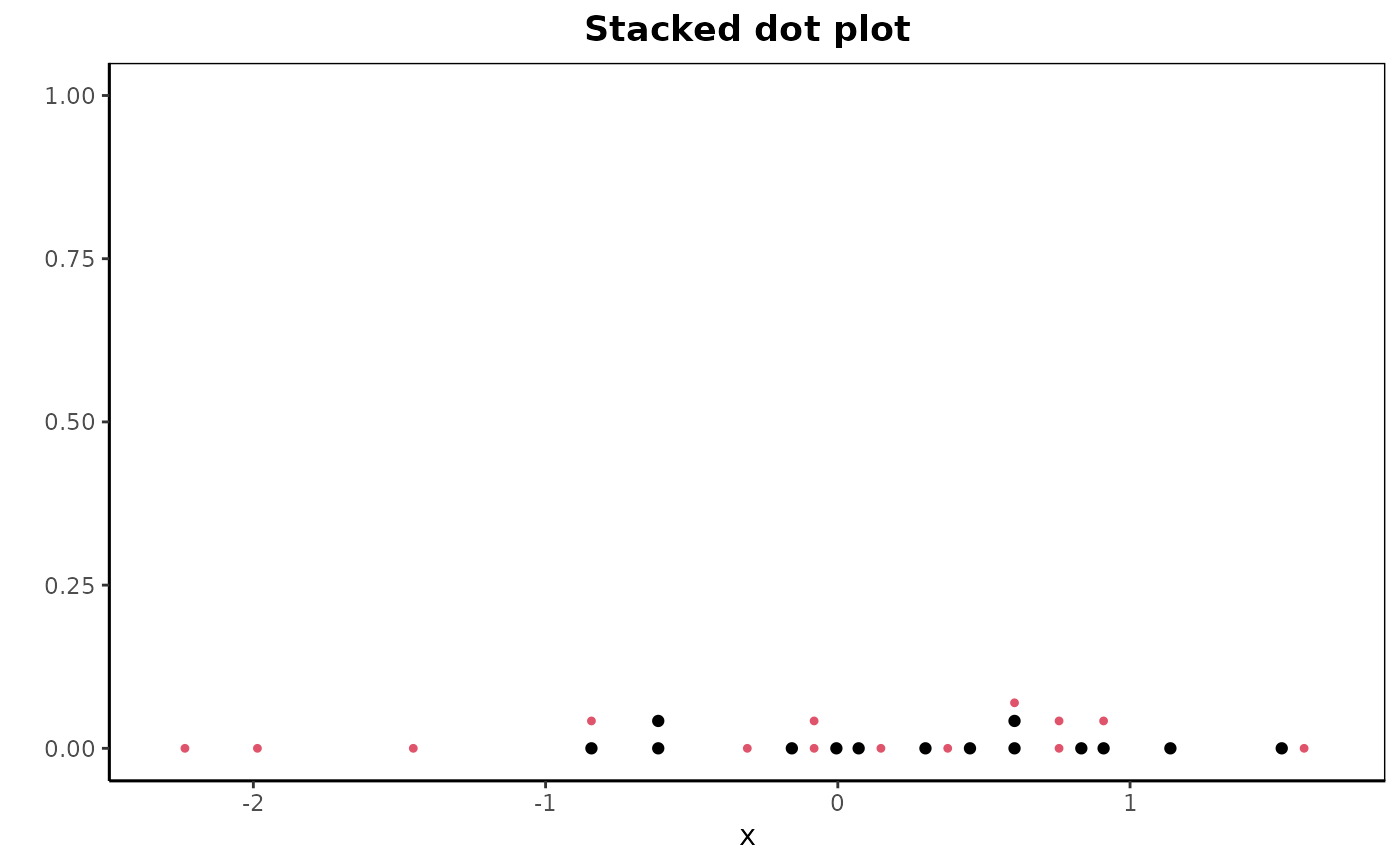
dotPlot(x, group = g, stacked = TRUE, pch = c(19, 20), main = "Stacked dot plot")
# Dot plot with groups and stacking
dotPlot(x, group = g, stacked = TRUE, pch = c(19, 20), main = "Stacked dot plot")
 #> Warning: calling par(new=TRUE) with no plot